Description
This worksheet teaches children to go beyond making graphs to understanding the story behind the data. It’s about asking questions, collecting data, and creating visuals that communicate meaning.
Why the Process Matters More Than the Product
Creating graphs builds skills in:
- Question formulation: Learn what questions data can answer
- Data organization: Sort and categorize information
- Visual communication: Choose the best way to show information
- Pattern recognition: See trends and stories in the data
- Critical thinking: Evaluate what makes a graph effective
Research shows kids who follow the full data process retain 50% more and apply skills in new situations.
What’s Inside This Data Storytelling Toolkit?
Activities guide students through the complete data process:
Phase 1: Question Formulation
- Brainstorm questions the data can answer
- “What do we want to know about our classroom?”
- Choose measurable questions
Phase 2: Data Collection
- Create simple collection sheets
- Tally observations or surveys
- “How will we record our information?”
Phase 3: Data Organization
- Sort and categorize data
- Create frequency tables and tallies
- “What patterns do we see?”
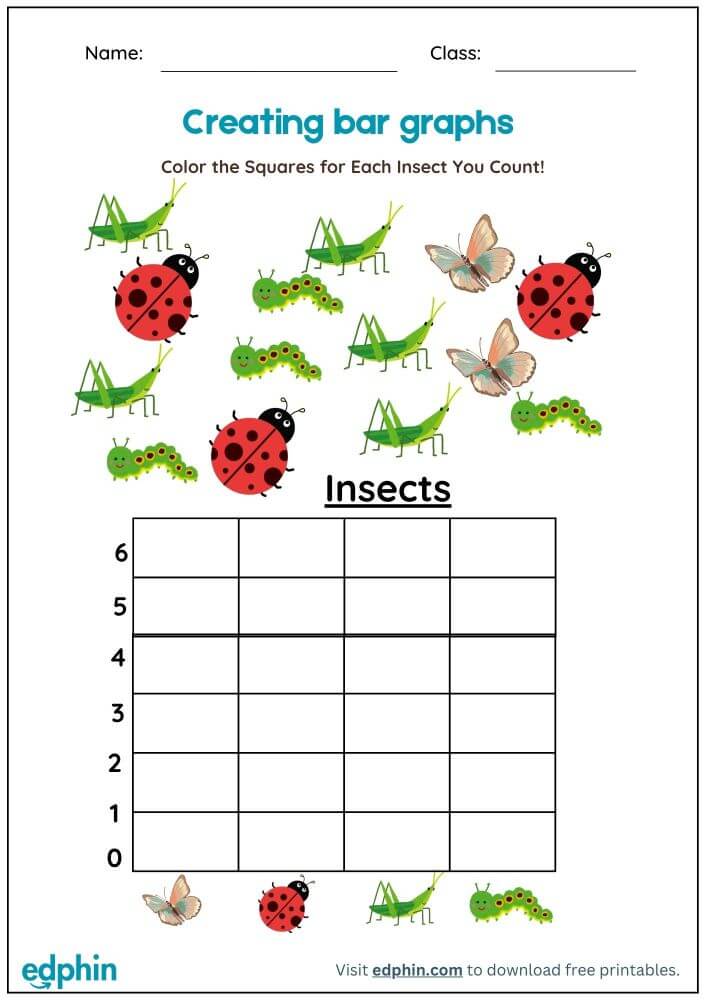
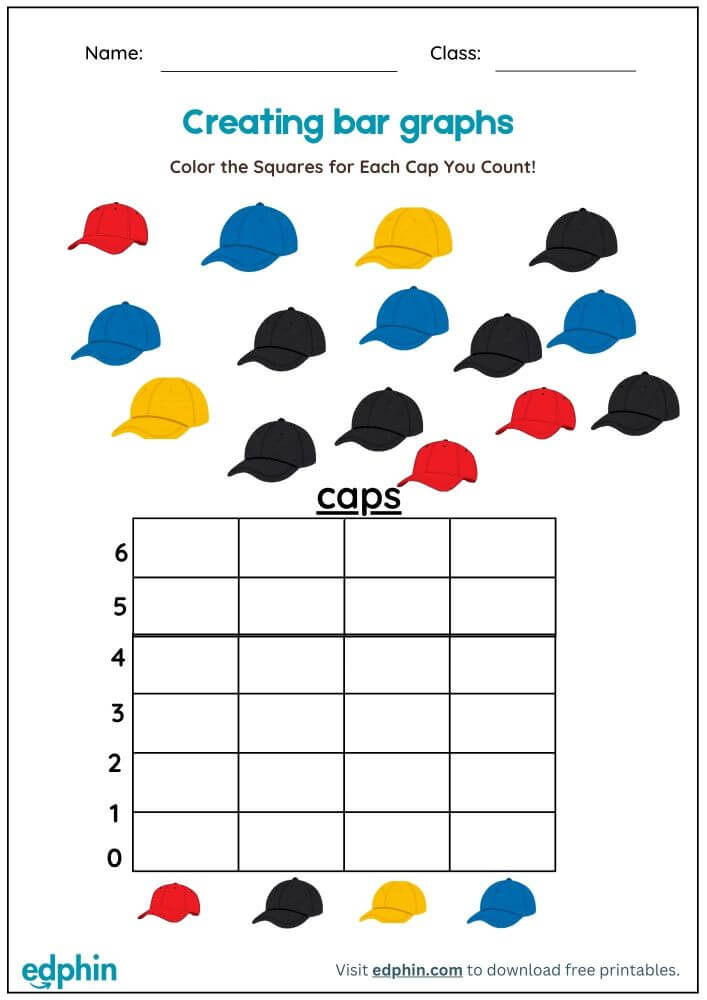
Phase 4: Graph Creation
- Learn bar graph elements: title, axes, labels, scale
- Choose scales and intervals
- “How can we make our data easy to understand?”
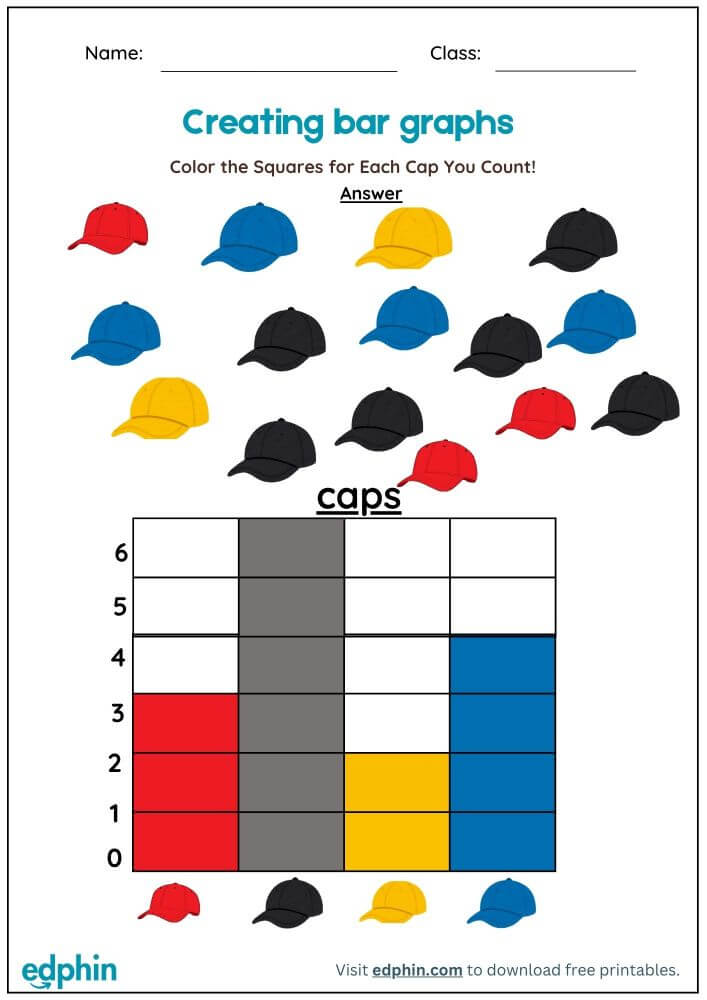
Phase 5: Storytelling
- Write about what the graph shows
- Compare predictions with results
- “What story does our data tell?”
3 Teaching Strategies That Build Data Intuition
- Start with Real Questions: Use topics kids care about—snacks, pets, hobbies—to make learning relevant.
- Embrace Messy Data: Celebrate unexpected results as real learning opportunities.
- Focus on Communication: Ask “How could your graph be clear to a friend?” to build audience awareness.
Ready to Transform Data Into Visual Stories?
This worksheet develops data literacy and storytelling skills, turning numbers into narratives. Today’s bar chart is tomorrow’s effective communication tool.
Call to Action:
Click ‘Add to Cart’ to get instant access to our Create Bar Chart Worksheet. Start the journey from data collection to visual storytelling today!

Reviews
There are no reviews yet.