Description
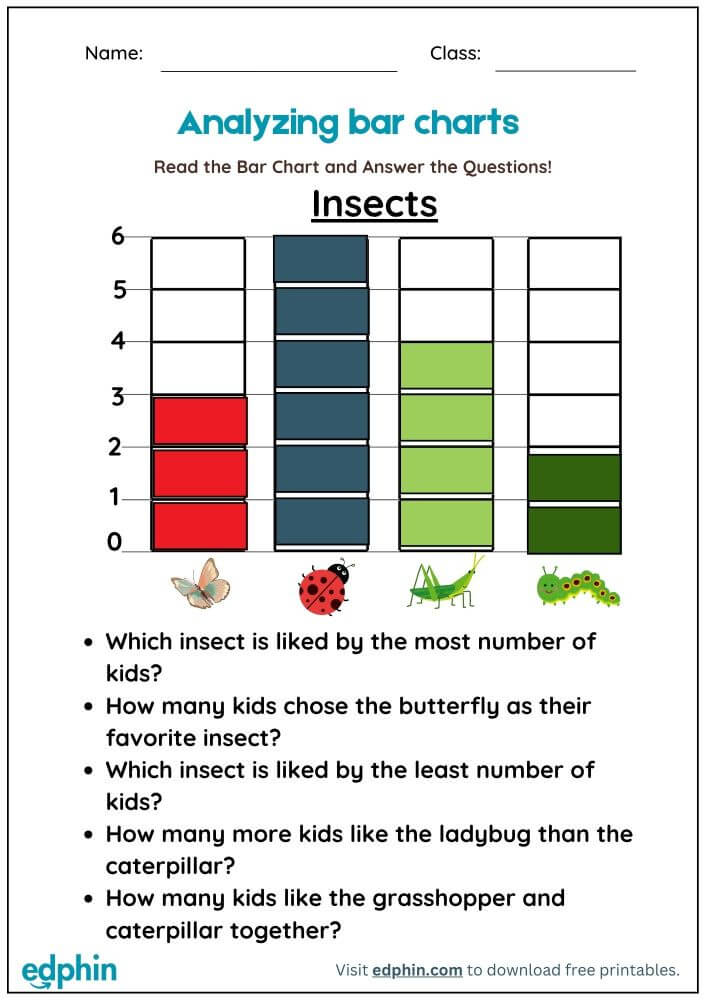
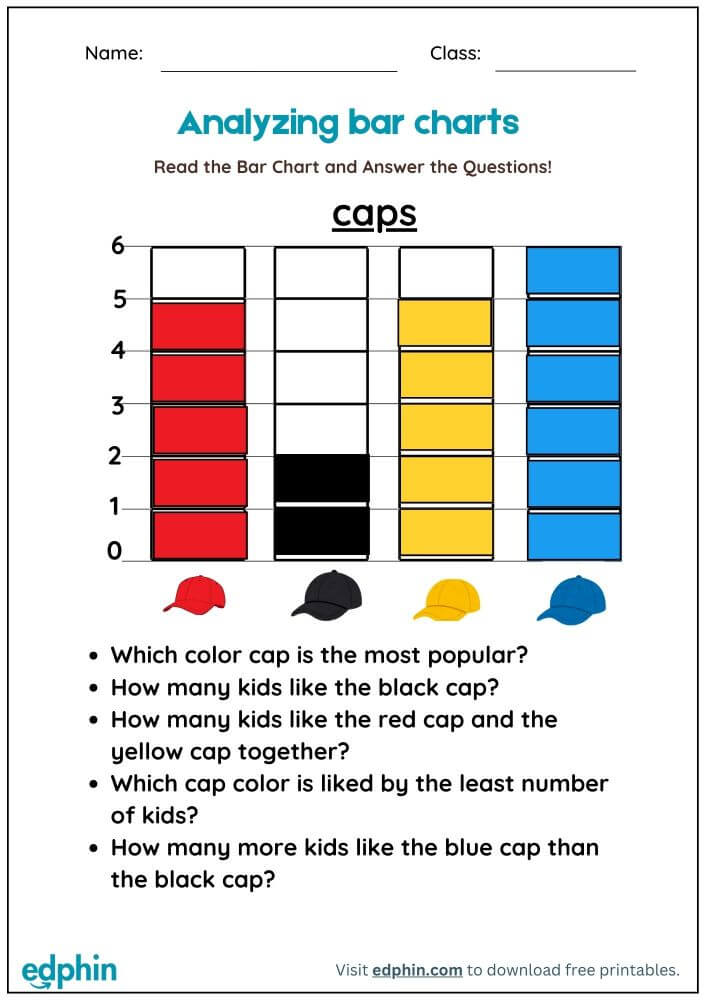
This worksheet helps children go beyond reading graphs to understanding what the data tells us. It’s not just about finding numbers; it’s about becoming a data detective and interpreting the story behind the chart.
Why Data Literacy Matters
Reading graphs builds skills for:
- Real-world application: Using data in sports, weather, surveys, and daily life
Research shows kids with strong data skills perform 40% better in science and social studies and evaluate information more effectively.
What’s Inside This Data Detective Kit?
Activities progress from basic reading to deeper interpretation:
Level 1: Graph Basics
- Learn bar chart parts: title, axes, labels, scale
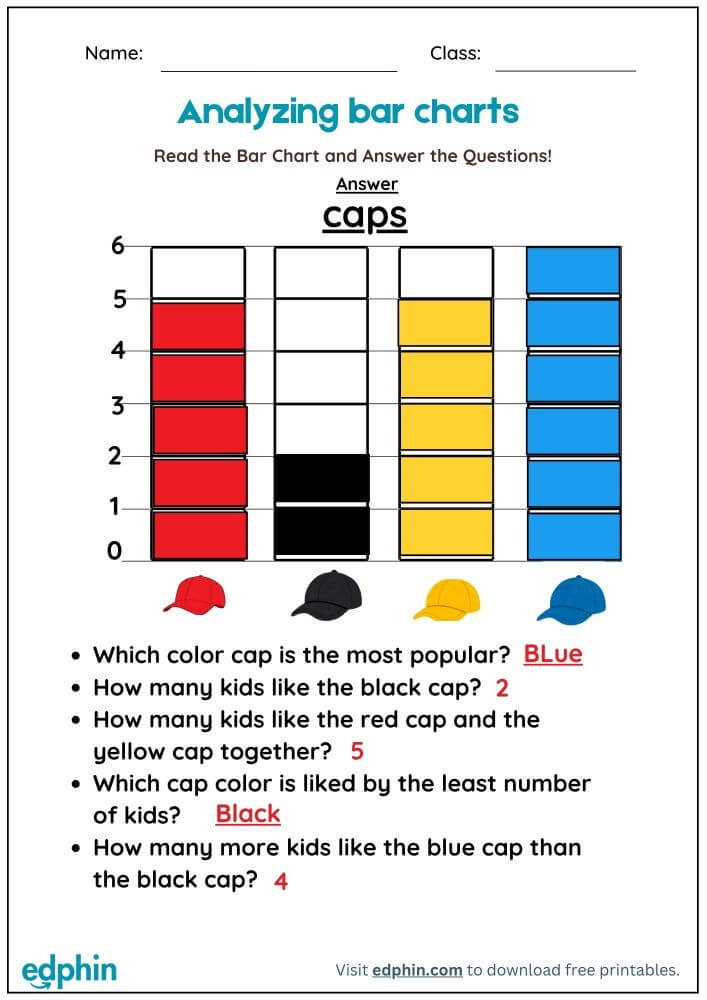
- Read exact values from bars
- Answer “What is the value of this bar?” questions
Level 2: Simple Comparisons
- Identify most and least popular categories
- Compare values between bars
- Answer “How many more chose X than Y?” questions
Level 3: Critical Thinking
- Make inferences from graphs
- Predict trends and patterns
- Answer “What might happen if this trend continues?” questions
Level 4: Real-World Application
- Analyze graphs from real contexts: sports, weather, surveys
- Create questions for graphs
- Interpret “What story does this graph tell?”
3 Teaching Strategies to Build Data Literacy
- Think Aloud: Model interpretation. Example: “The tallest bar is chocolate ice cream, so it’s most popular.”
- Connect to Personal Experience: Use graphs about topics kids care about—games, pets, sports—for engagement.
Ready to Raise a Critical Thinker?
This worksheet builds data literacy and critical thinking, turning passive information consumers into active analysts. Today’s bar chart reading is tomorrow’s complex data understanding.
Call to Action:
Click ‘Add to Cart’ to get instant access to our Read Bar Chart Worksheet. Start building essential data literacy skills today!
Reviews
There are no reviews yet.