Description
This worksheet helps students go beyond reading graphs to understanding what the data tells us. It’s about becoming a data detective who can interpret information and see the story behind the numbers.
Why Data Literacy is a Secret Superpower
Reading graphs builds skills in:
- Real-world application: Useful in sports, weather, and daily decision-making
Research shows children with strong data skills perform 40% better across subjects and can evaluate information more effectively.
What’s Inside This Data Detective Toolkit?
Activities guide students from basic reading to advanced interpretation:
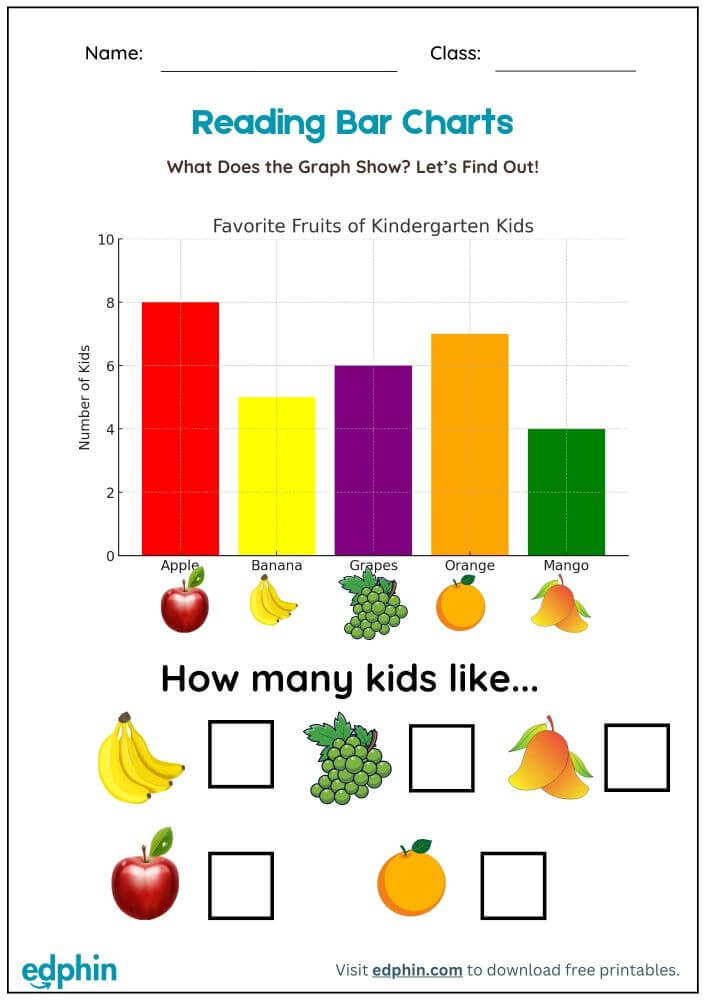
Level 1: Graph Basics
- Identify title, axes, labels, and scale
- Practice reading exact values
- Understand what each graph component shows
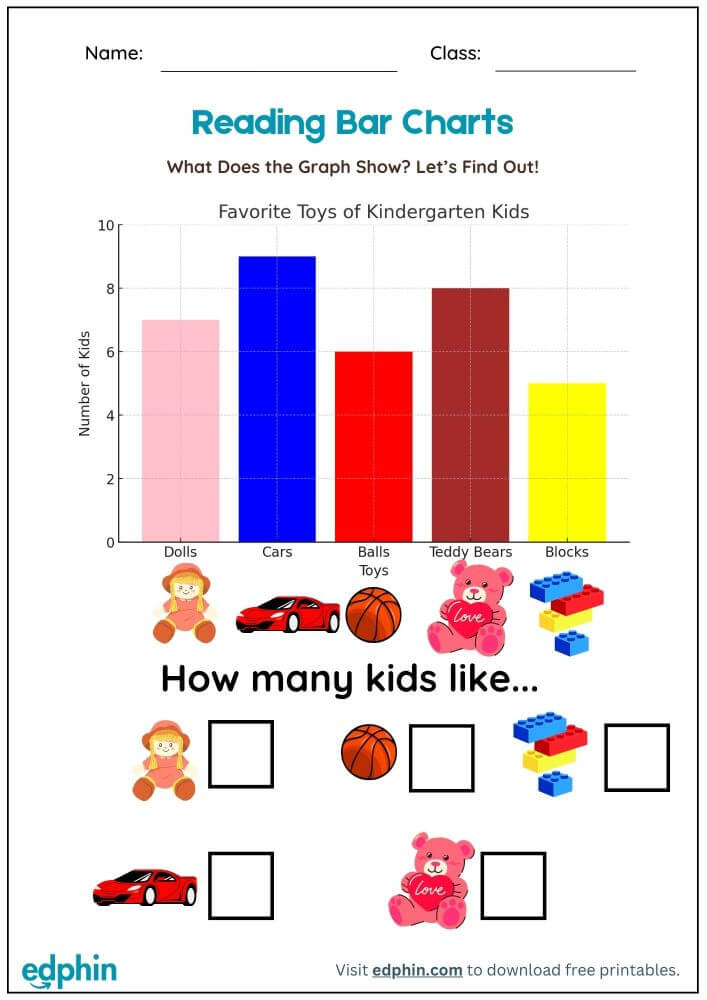
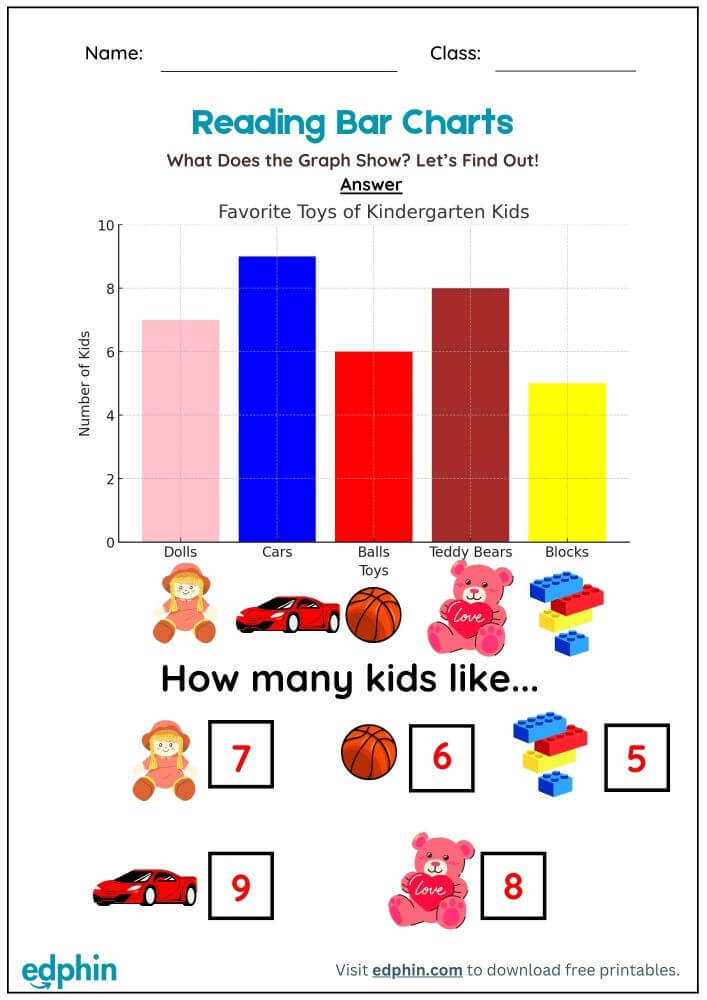
Level 2: Literal Investigation
- Answer “how many” questions
- Identify most/least popular categories
- Practice careful data reading
Level 3: Comparative Analysis
- Compare values between bars
- Calculate differences and relationships
- Answer “How many more chose X than Y?”
Level 4: Inferential Reasoning
- Predict based on graph patterns
- Draw conclusions about what the data means
- Ask “What might happen if this trend continues?”
Level 5: Real-World Application
- Analyze graphs from real contexts
- Evaluate effective or misleading graphs
- Create questions for others to answer
3 Teaching Strategies That Build Data Intuition
- Think Aloud: Model your reasoning while interpreting a graph. “The tallest bar is chocolate ice cream, so it’s most popular.”
- Connect to Personal Experience: Use familiar topics like games or family preferences to make graphs relevant.
Ready to Raise Critical Thinkers?
This worksheet develops data literacy and critical thinking skills that turn passive viewers into active analysts. Today’s bar chart skills become tomorrow’s ability to interpret complex information.
Call to Action:
Click ‘Add to Cart’ to get instant access to our Read Bar Chart Worksheet. Start building essential data skills today!
Reviews
There are no reviews yet.